District: Rancho Dominguez
System: Dominguez System
A printable version of this report is also available.
Welcome
 At Cal Water, we've been dedicated to providing "Trust on Tap" for 100 years. That's delivering safe, clean, reliable water our customers and communities can trust—24 hours per day, 7 days per week, 365 days per year since 1926. We treat the water to make it safe to use and drink, test it to confirm it meets all standards, and stay on top of emerging water quality regulations, focusing on your water so you don't have to.
Throughout our history, we've approached evolving water quality issues and standards with resilience, ingenuity, and commitment, overcoming challenges time and time again to protect our customers' health and safety. For example, as regulations become more stringent, we prepare early and will add or adjust treatment as needed to confirm that the water we deliver meets or surpasses all standards. I encourage you to read this year's local water quality report, formally called your Consumer Confidence Report. It details any constituents detected in your water supply in 2025 and shows how your water compares to federal and state standards. It also provides information on current hot topics and steps we take to protect your water.
Notably, in this system in 2025, we conducted 23,396 tests on 4,543 water samples for 262 constituents. We are pleased to confirm that we met every primary and secondary federal and state water quality standard last year.
But, our promise to provide quality, service, and value means more than just treating and testing water. It means maintaining and upgrading the water system infrastructure needed to transport water from its source through a vast network of pumps, tanks, and pipes to your tap. It means having expert professionals available both to assist with routine services safely and efficiently, and to handle emergencies that could arise in the middle of the night. It also means that, even as costs keep increasing nationwide, we do everything we can to operate as efficiently as possible to keep your water service affordable. It is this commitment to serving you that will take us into the next 100 years.
If you have any questions, we are here to help. You can contact your local office by phone or through the Contact Us page You can also get water service news on our web site, in your monthly bill, and via our Facebook, X, and Instagram pages. Please also keep your contact information up to date by visiting ccu.calwater.com or myaccount.calwater.com so you can receive emergency and other important information.
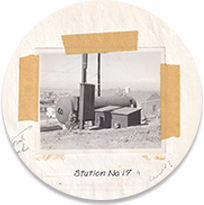
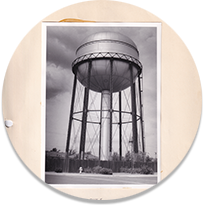
This water quality report includes selected photos from across the past 100 years. As we celebrate our centennial, we look back on the legacy that is the foundation for our future success. To learn more about our century of service, we invite you to visit 100years.calwatergroup.com.
Sincerely,
Ralph Felix, District Manager, Rancho Dominguez District
Action Items
There were no significant issues in your water system in 2025, and we have no recommended action items for our customers in this area.
Rancho Dominguez District
2632 W. 237th Street
Torrance, CA 90505
(310) 257-1400
Your Water System
 Cal Water has provided high-quality water utility services in the Dominguez area since 2000. Our Dominguez system serves most of the city of Carson and portions of Long Beach, Torrance, Compton, and unincorporated areas in Los Angeles County.
To meet our customers' needs, we use a combination of local groundwater and surface water purchased from Metropolitan Water District of Southern California (MWD), which is obtained from the Colorado River and the State Water Project in northern California. The Dominguez water system currently includes 374 miles of pipeline, 10 active wells, 12 storage tanks, and seven MWD connections.
Our company-wide water quality assurance program includes vigilant monitoring throughout our systems and testing at our state-of-the-art laboratory. Additionally, we proactively maintain and upgrade facilities to provide a reliable, high-quality supply.
Chloramines
Chloramines are most commonly formed when ammonia is added to chlorine. They are used as a disinfectant to treat your drinking water and provide long-lasting disinfection as water moves through pipes to consumers.
Water Resource Sustainability
Cal Water helps our customers conserve water by offering programs and incentives to reduce indoor and outdoor water use, develop more efficient habits, and educate the next generation about the importance of managing water resources sustainably. We also continue to invest diligently in our infrastructure to reduce the amount of water lost to pipeline leaks and, in 2022, completed an updated assessment of the impacts of climate change on water supply and demand. Whether in wet or dry years, it's important that we make saving water every day a way of life. Using water wisely will ensure that we have enough water in periods of drought and for generations to come.
Visit the Conservation page for details.
If you have any questions or concerns, please contact our local office by phone at (310) 257-1400 or through the Contact Us page.
Water Quality
The Water Quality Lab
 Water professionals collect samples from throughout the water system for testing at our recently upgraded, state-of-the-art water quality laboratory, which is certified each year through the stringent Environmental Laboratory Accreditation Program (ELAP).
Our laboratory team tests the water for 326 constituents with equipment so sensitive it can detect levels as low as one part per trillion. In order to maintain the ELAP certification, all of our scientists must pass blind-study proficiency tests for every water quality test performed. Water quality test results are entered into our Laboratory Information Management System (LIMS), a sophisticated software program that enables us to react quickly to changes in water quality and analyze water quality trends in order to plan effectively for future needs.
Cross-Connection Control
Cal Water has a robust cross-connection control program that protects the high-quality water we deliver. Cross-connection control is critical so that activities on customers' properties do not affect the public water system. Our certified cross-connection control specialists confirm that existing backflow prevention assemblies are tested annually, identify the risk posed by service connections, and enforce and manage the installation of new commercial and residential assemblies.
Backflow is the undesired or unintended reversal of flow of water and/or other liquids, gases, or other substances into the public water supply. Backflow can occur when certain pressure conditions exist within the public water system or a customer's plumbing, so our customers are our first line of defense to prevent it. A minor home improvement project—without the proper protections—can create a potentially hazardous situation, so careful adherence to plumbing codes and standards will help keep the community's water supply safe. Please be sure to utilize the advice or services of a qualified plumbing professional.
Many water-use activities involve substances that, if allowed to enter the distribution system, would be aesthetically displeasing or could even present health concerns.
Some common cross-connections are:
- Garden hoses connected to a hose bib without a simple hose-type vacuum breaker (available at a home improvement store).
- Improperly installed toilet tank fill valves that do not have the required air gap between the valve or refill tube.
- Landscape irrigation systems that do not have the proper backflow prevention assembly installed on the supply line.
The list of materials that could potentially contaminate the water system is vast. According to the United States Environmental Protection Agency (EPA), a wide variety of substances have contaminated drinking water systems throughout the country because of poor cross-connection control. Examples include:
- Antifreeze from a heating system.
- Lawn chemicals from a garden hose or sprinkler head.
- Blue water from a toilet tank.
- Carbonated water from a soda dispenser.
Customers must check that all plumbing is in conformance with local plumbing codes. Additionally, state law requires certain types of facilities to install and maintain backflow prevention assemblies at the water meter. Cal Water's cross-connection control staff will determine whether you need to install a backflow prevention assembly based on water use at your location.
DWSAPP
 We encourage customers to join us in our efforts to prevent water pollution and protect our most precious natural resource.
In 2002, Cal Water submitted to the Division of Drinking Water (DDW) a Drinking Water Source Assessment and Protection Program (DWSAPP) report for each water source in the water system. The DWSAPP report identifies possible sources of contamination to aid in prioritizing cleanup and pollution prevention efforts. All reports are available for viewing or copying at our office.
The water sources in your district are considered most vulnerable to:
- Agriculture
- Recreation
- Urban/stormwater runoff
- Increasing urbanization in the watershed
- Wildlife
- Drinking water treatment plants
- Chemical/petroleum processing
- Known contaminant plumes
- Above- and underground storage tanks
- Automobile body/repair shops
- Machine shops
- Transportation terminals
- Permitted waste discharges
- Wastewater
- Research laboratories
- Utility stations (maintenance areas)
- Wells (oil, gas, geothermal)
- Stormwater discharges
- Hardware/lumber/parts stores
- Metal plating/fabrication
- Gas stations
- Plastics/synthetics producers
- Dry cleaners
- Electrical/electronic manufacturing
- Large equipment storage yards
Your 2025 Results
Fluoride
State law requires Cal Water to add fluoride to drinking water if public funding is available to pay for it, and it is a practice endorsed by the American Medical Association and the American Dental Association to prevent tooth decay. In this area, local water is blended with purchased water that has fluoride in it. Show the table in this report to your dentist to see if he or she recommends giving your children fluoride supplements.
More information about fluoridation, oral health, and related issues can be found on the DDW web site.
For general information on water fluoridation, see the fluoride page.
Water Hardness
Hardness is a measure of the magnesium, calcium, and carbonate minerals in the water. Water is considered soft if its hardness is less than 75 parts per million (ppm), moderately hard at 75 to 150 ppm, hard between 150 and 300 ppm, and very hard at 300 ppm or higher.
Hard water is generally not a health concern, but it can have an impact on how well soap lathers and is significant for some industrial and manufacturing processes. Hard water may also lead to mineral buildup in pipes or water heaters.
Some people with hard water opt to buy a water softener for aesthetic reasons; however, some water softeners add salt to the water, which can cause problems at wastewater treatment plants. Additionally, people on low-sodium diets should be aware that some water softeners increase the sodium content of the water.
For more information on water hardness, visit the water hardness video.
Possible Contaminants
 All drinking water, including bottled water, may reasonably be expected to contain at least small amounts of some contaminants. The presence of contaminants does not necessarily indicate that water poses a health risk.
More information about contaminants and potential health effects can be obtained by calling the EPA Safe Drinking Water Hotline at (800) 426-4791.
The sources of drinking water (both tap and bottled) include rivers, lake, streams, ponds, reservoirs, springs, and wells. As water travels over the surface of the land or through the ground, it dissolves naturally occurring minerals—and in some cases radioactive material—and can pick up substances resulting from the presence of animals or human activities. Prior to entering the distribution system, source water with constituents over maximum contaminant levels is treated to reduce levels and meet standards set by public health experts.
Contaminants that may be present in source water include:
- Microbial contaminants, such as viruses and bacteria, which may come from sewage treatment plants, septic systems, agricultural livestock operations, and wildlife.
- Inorganic contaminants, such as salts and metals, which can be naturally occurring or result from urban stormwater runoff, industrial or domestic wastewater discharges, oil and gas production, mining, or farming.
- Pesticides and herbicides, which may come from a variety of sources such as agriculture, urban stormwater runoff, and residential uses.
- Organic chemical contaminants, including synthetic and volatile organic compounds, which are byproducts of industrial processes and petroleum production, and can also come from gas stations, urban stormwater runoff, agricultural applications, and septic systems.
- Radioactive contaminants, which can be naturally occurring or the result of oil and gas production and mining activities.
In order to keep tap water safe to drink, EPA and DDW prescribe regulations that limit the amount of certain contaminants in water provided by public water systems. Food and Drug Administration (FDA) regulations establish limits for contaminants in bottled water, which must provide the same protection for public health.
Some people may be more vulnerable to contaminants in drinking water than the general population. Immunocompromised people, such as those with cancer undergoing chemotherapy, those who have undergone organ transplants, and those with HIV/AIDS or other immune system disorders; some elderly people; and infants can be particularly at risk from infections. These people should seek advice from their health care providers about drinking water contaminants. EPA and Centers for Disease Control and Prevention (CDC) guidelines on appropriate means to lessen the risk of infection by Cryptosporidium and other microbial contaminants are available from the Safe Drinking Water Hotline.
About Lead
 As the issue of lead in water continues to be top of mind for many Americans, Cal Water wants to assure you about the quality of your water. We are compliant with health and safety codes mandating use of lead-free materials in water system replacements, repairs, and new installations. We have no known lead service lines in our systems. We test and treat, if necessary, water sources to confirm that the water delivered to customer meters meets all water quality standards and is not corrosive toward plumbing materials.
The water we deliver to your property meets lead standards. However, if present, elevated levels of lead can cause serious health problems, especially for pregnant women and young children. Lead in drinking water is primarily from materials and components associated with service lines and home plumbing (for example, lead solder used to join copper plumbing, and brass and other lead-containing fixtures).
Cal Water is responsible for providing high-quality drinking water to our customers' meters, but cannot control the variety of materials used in properties' plumbing components. When your water has been sitting for several hours, you can minimize the potential for lead exposure by flushing your tap for 30 seconds to 2 minutes before using water for drinking or cooking.
If you are concerned about lead in your water, you may wish to have your water tested by a certified lab. More information about lead in drinking water can be found through the Safe Drinking Water Hotline at (800) 426-4791 or www.epa.gov/safewater/lead.
Testing for Lead in Schools
The State of California required that all public schools built before 2010 test for lead in their drinking water. We are committed to supporting our school districts' efforts to protect students and confirm that the drinking water at their school sites are below regulatory limits. We completed those tests, working with all school districts in our service area that serve kindergarten through 12th grade to develop sampling plans, test samples, and conduct follow-up monitoring, if needed, for corrective actions. The state will require us to retest most schools beginning in 2027.
Please see our Testing for Lead in Schools web page for more information. For specific information regarding local school data, see the State web portal's lead sampling in schools page.
Lead and Copper Rule
The Lead and Copper Rule requires us to test water inside a representative number of homes that have plumbing most likely to contain lead and/or lead solder to determine the presence of lead and copper or any action level exceedance. An action level is the concentration of a contaminant which, when exceeded, triggers corrective actions before it becomes a health concern. If action levels are exceeded, either at a customer's home or system-wide, we work with the customer to investigate the issue and/or implement corrosion control treatment to reduce lead levels.
Lead Service Line Inventory (LSLI)
Protecting our customers' health and safety is our highest priority. As part of this commitment, we have been working to identify any old water service lines and fittings that may contain lead so that customers can make necessary replacements. This effort complies with EPA's 2021 Lead and Copper Rule Revisions, which require that public water systems comply with the regulations starting on October 16, 2024. These requirements include an initial service line inventory. You can find maps that provide details of our ongoing service line inventory on our Lead Service Line Inventory page.
In your system, results from our lead monitoring program, conducted in accordance with the Lead and Copper Rule, were below the action level for the presence of lead.
PFAS
 In April 2024, EPA finalized a National Primary Drinking Water Regulation (NPDWR) for six PFAS in drinking water:
- MCL of 4 ppt for PFOS and PFOA.
- MCL of 10 ppt for PFHxS, PFNA, and GenX.
- Hazard Index of 1.0 combined for PFHxS, PFNA, PFBS, and GenX.
Water systems must begin monitoring for these PFAS by 2027 and comply with the regulation by 2029.
Because protecting our customers' health and safety is our highest priority, we are committed to complying with all requirements set by the public health experts. We had prepared for the EPA regulation and its potential impact on—and any treatment needed in—our systems, and had already evaluated the impact of the proposed regulation so that we were prepared to comply with the final MCLs.
We also have protocols to test our water sources for compliance with the new MCLs. We have long followed recommendations from DDW, and even went beyond by testing every active source in our California systems years ago. Although not required at the time, we believed it was the right thing to do. In any cases across our service areas where detections were above the levels at which state public health experts have recommended water suppliers take action (the previous response level), we took the affected sources out of service until treatment was/could be installed.
Our active water sources are in compliance with current California response levels, based on the running annual average at each site. The response level, which is the level at which a water system should make operational changes to reduce the concentration of a compound, is set with a margin of protection for all people (including sensitive populations) over a lifetime of exposure.
Additionally, we believe a comprehensive approach is needed to properly address the situation. We urged the EPA to establish a consistent, science-based standard as quickly as feasible, and strongly supported state legislation that will prohibit the sale and use of certain products that contain PFAS, require the certification of accurate testing methods for PFAS, and establish a publicly accessible database that houses the sources of PFAS entering water supplies. We have also filed lawsuits to hold PFAS manufacturers responsible—and ultimately prevent our customers from bearing the costs of treatment, to the extent possible—and are pursuing grants where available to further offset customer cost impacts.
As background, PFAS are manmade compounds that have been used to make carpets, clothing, fabrics for furniture, paper packaging for food, and other materials (e.g., cookware) that are resistant to water, grease, or stains. These compounds are also used for firefighting at airfields, which is one way they have found their way into groundwater in certain areas.
Studies indicate that long-term exposure to PFAS over certain levels could have adverse health effects, including developmental effects to fetuses during pregnancy or infants; cancer; or impacts on liver, immunity, thyroid, and other functions. Potential health effects related to PFAS are still being studied, and research is still evolving on this issue.
More information on PFAS is available on the DDW web site and our PFAS page.
Key Definitions
 In Compliance: Does not exceed any applicable MCL, SMCL, or action level, as determined by DDW. For some compounds, compliance is determined by averaging the results for one source over a one-year period.
Level 1 Assessment: A Level 1 assessment is a study of the water system to identify potential problems and determine, if possible, why total coliform bacteria have been found in the system.
Level 2 Assessment: A Level 2 assessment is a very detailed study of the water system to identify potential problems and determine,if possible, why an E. coli MCL violation has occurred and/or why total coliform bacteria have been found in the system on multiple occasions.
Maximum Contaminant Level (MCL): The highest level of a contaminant that is allowed in drinking water. Primary MCLs are set as close to the PHGs or MCLGs as is economically and technologically feasible. Secondary MCLs (SMCLs) are set to protect the odor, taste, and appearance of drinking water.
Maximum Contaminant Level Goal (MCLG): The level of a contaminant in drinking water below which there is no known or expected risk to health. MCLGs are set by the U.S. Environmental Protection Agency.
Maximum Residual Disinfectant Level (MRDL): The highest level of a disinfectant allowed in drinking water. There is convincing evidence that addition of a disinfectant is necessary for control of microbial contaminants.
Maximum Residual Disinfectant Level Goal (MRDLG): The level of a drinking water disinfectant below which there is no known or expected risk to health. MRDLGs do not reflect the benefits of the use of disinfectants to control microbial contaminants.
Notification Level (NL) and Response Level (RL): Health-based advisory levels for unregulated contaminants in drinking water. They are used by DDW to provide guidance to drinking water systems.
Primary Drinking Water Standards (PDWS): MCLs, MRDLs, and TTs for contaminants that affect health along with their monitoring, reporting, and water treatment requirements.
Public Health Goal (PHG): The level of a contaminant in drinking water below which there is no known or expected risk to health. PHGs are set by the California Environmental Protection Agency without regard to technological or economic feasibility.
Regulatory Action Level (AL): The concentration of a contaminant which, if exceeded, triggers treatment or other requirements that a water system must follow.
Treatment Technique (TT): A required process intended to reduce the level of a contaminant in drinking water.
Variances and Exemptions: Permissions from the State Water Resources Control Board (State Board) to exceed an MCL or not comply with a TT under certain conditions.
Standard Abbreviations
- AL: Action level
- Max: Maximum
- MFL: Million fibers per liter
- Min: Minimum
- N/A: Not applicable
- ND: Contaminant not detected
- NL: Notification level
- NTU: Nephelometric turbidity unit
- pCi/L: Picocuries per liter (a measure of radiation)
- ppb: Parts per billion or micrograms per liter (µg/L)
- ppm: Parts per million or milligrams per liter (mg/L)
- ppq: Parts per quadrillion or picogram per liter (pg/L)
- ppt: Parts per trillion or nanograms per liter (ng/L)
- RAA: running annual average
- µS/cm: Microsiemens/centimeter
Table Introduction
 Every year, Cal Water performs hundreds of thousands of tests to monitor the quality of our water. If any contaminants are detected, they are included in this annual water quality report. However, most of the contaminants we test for are not detected, so they are not listed.
See the Potential Contaminants web page for a complete list of contaminants for which we test.
In the table, water quality test results are divided into four major sections: "Primary Drinking Water Standards," "Secondary Drinking Water Standards," "State-Monitored Contaminants with Notification Levels," and "Unregulated Compounds." Primary standards protect public health by limiting the levels of certain constituents in drinking water. Secondary standards are set for substances that don't impact health but could affect the water's taste, odor, or appearance. Some unregulated substances (hardness and sodium, for example) are included for your information. The State allows us to monitor for some contaminants less than once per year because the concentrations of these contaminants do not change frequently. As such, some of our data, though representative, are more than one year old.
Substance Sources
- DI: Byproduct of drinking water disinfection
- DK: Decay of natural and manmade deposits
- DS: Drinking water disinfectant added for treatment
- EN: Naturally present in the environment
- ER: Erosion of natural deposits
- FE: Human and animal waste
- FL: Water additive that promotes strong teeth; discharge from fertilizer and aluminum factories
- FR: Runoff and leaching from fertilizer use; leaching from septic tanks and sewage
- IC: Internal corrosion of household plumbing systems
- IM: Discharge from industrial manufacturers
- IO: Substances that form ions when in water
- IW: Industrial waste
- OD: Discharges of oil-drilling waste and from metal refineries
- OM: Naturally occurring organic materials
- PG: Discharge from petroleum, glass, and metal refineries; discharge from mines and chemical manufacturers; runoff from livestock lots (feed additive)
- RU: Runoff/leaching from natural deposits
- SO: Soil runoff
- SW: Seawater influence
- VA: Various natural and manmade sources
- WD: Leaching from wood preservatives
- UR: Unregulated constituents with no source listed and that do not have standardized "source of substance" language
Our testing equipment is so sensitive, it can detect constituents as small as 1 part per trillion. That is equivalent to 1 inch over 15 million miles.
2025 Water Quality
Contaminants not detected (ND) are not listed.
Primary Drinking Water Standards |
||||||||
| Microbiological | Year Tested | Unit | MCL | PHG (MCLG) | In Compliance | Distribution System-Wide | Source | |
| Highest Monthly | ||||||||
| Fecal coliform and E. coli | 2025 | Positive Samples | 0 | (0) | Yes | 0 | FE | |
| Radiological | Year Tested | Unit | MCL | PHG (MCLG) | In Compliance | Groundwater | Source | |
| Range | Average | |||||||
| Gross alpha particle activity | 2017-2024 | pCi/L | 15 | (0) | Yes | ND-3.0 | ND | ER |
| Inorganic Chemicals | Year Tested | Unit | MCL | PHG (MCLG) | In Compliance | Groundwater | Source | |
| Range | Average | |||||||
| Fluoride | 2025 | ppm | 2 | 1 (4.0) | Yes | 0.18-0.73 | 0.54 | ER, FL |
| Selenium | 2017-2025 | ppb | 50 | 30 (50) | Yes | ND-5.7 | ND | PG, ER |
| Lead and Copper | Year Tested | Unit | AL | PHG (MCLG) | In Compliance | Distribution System-Wide | Source | |
| 90th Percentile | Samples > AL | |||||||
| Copper | 2023 | ppm | 1.3 | 0.3 | Yes | 0.307 | 0 of 50 | IC, ER, WD |
| Lead | 2023 | ppb | 15 | 0.2 | Yes | ND | 0 of 50 | IC, IM, ER |
| Disinfection Byproducts | Year Tested | Unit | MCL | PHG (MCLG) | In Compliance | Distribution System-Wide | Source | |
| Range | Highest Annual Average | |||||||
| Total haloacetic acids (THAA) | 2025 | ppb | 60 | N/A | Yes | ND-21 | 18 | DI |
| Total trihalomethane (TTHM) | 2025 | ppb | 80 | N/A | Yes | 2.5-63 | 47 | DI |
| Disinfectants | Year Tested | Unit | MRDL | MRDLG | In Compliance | Distribution System-Wide | Source | |
| Range | Average | |||||||
| Total chlorine | 2025 | ppm | 4 | 4 | Yes | 0.20-3.2 | 1.9 | DS |
Secondary Drinking Water Standards |
||||||||
| Contaminants | Year Tested | Unit | SMCL | PHG (MCLG) | In Compliance | Groundwater | Source | |
| Range | Average | |||||||
| Chloride | 2017-2025 | ppm | 500 | N/A | Yes | 21-150 | 48 | RU, SW |
| Color, apparent1 | 2017-2025 | CU | 15 | N/A | Yes | ND-20 | 1.6 | OM |
| Specific conductance | 2017-2025 | US | 1600 | N/A | Yes | 110-910 | 475 | SW, IO |
| Manganese | 2021-2025 | ppb | 50 | N/A | Yes | ND-35 | ND | RU |
| Odor | 2017-2025 | T.O.N. | 3 | N/A | Yes | ND-2.0 | ND | OM |
| Sulfate | 2017-2025 | ppm | 500 | N/A | Yes | ND-160 | 29 | RU, IW |
| Total dissolved solids | 2017-2025 | ppm | 1000 | N/A | Yes | ND-580 | 278 | RU |
| Turbidity (groundwater) | 2017-2025 | NTU | 5 | N/A | Yes | ND-3.1 | 0.22 | SO |
State-Regulated Contaminants with Notification Levels |
||||||||
| Contaminants | Year Tested | Unit | NL | PHG (MCLG) | In Compliance | Groundwater | Source | |
| Range | Average | |||||||
| Boron | 2025 | ppm | 1 | N/A | Yes | 0.11-0.16 | 0.13 | UR |
| N-nitrosodimethylamine (NDMA) | 2017-2025 | ppt | 10 | 3 | Yes | ND | ND | UR |
| Perfluorhexanesulfonic acid (PFHxS)2 | 2020-2025 | ppt | 3 | N/A | Yes | ND-3.6 | ND | UR |
Unregulated Compounds and Unregulated Contaminant Monitoring Rule (UCMR) |
||||||||
| Constituents | Year Tested | Unit | MCL | PHG (MCLG) | In Compliance | Groundwater | Source | |
| Range | Average | |||||||
| Alkalinity (total) | 2017-2025 | ppm | N/A | N/A | N/A | 140-200 | 157 | UR |
| Calcium | 2023-2025 | ppm | N/A | N/A | N/A | 17-100 | 37 | UR |
| Hardness (total) | 2023-2025 | ppm | N/A | N/A | N/A | 48-300 | 126 | UR |
| Potassium | 2023-2025 | ppm | N/A | N/A | N/A | 1.1-6.6 | 2.8 | UR |
| Magnesium | 2023-2025 | ppm | N/A | N/A | N/A | 1.6-20 | 8.1 | UR |
| Sodium | 2023-2025 | ppm | N/A | N/A | N/A | 46-88 | 59 | UR |
| pH | 2021-2025 | Units | N/A | N/A | N/A | 6.0-9.4 | 8.0 | UR |
1: In one sample in the Dominguez system, color, apparent exceeded the SMCL of 15 CU. The source water was being cleared and did not provide this water to the distribution system. The RAA is less then the SMCL. Compliance with the SMCL is based a RAA. We are monitoring the levels to confirm we do not exceed the SMCL RAA. The SMCL was set to protect you against unpleasant aesthetic effects, such as color, taste, odor, and the staining of plumbing fixtures and clothing when washed. Exceeding the SMCL does not pose a health risk.
2: PFAS are a broad class of chemicals, which includes PFOA, PFOS, PFBS, PFHxA, and PFHxS. NLs have been established for five of these compounds. Studies indicate that long-term exposure to PFOS/PFOA/PFBS/PFHxS/PFHxA over certain levels could have adverse health effects, including developmental effects to fetuses during pregnancy or breastfed infants; cancer; or liver, immunity, thyroid, and other effects. Cal Water worked closely with DDW and EPA to conduct extensive monitoring and identified the best available treatment technology for treatment of PFAS. Samples collected at well 290-01 exceeded the NL for FPHxS four times in 2024. The NL is the level at which notification must be issued to governing bodies. Notification was issued, and well 290-01 remained in service. The water remained under the RL and was in compliance.
Wholesaler Data
| Year Tested | Unit | MCL | PHG (MCLG) | In Compliance | Central Basin MWD1 | Source | ||||||||||||
| Treatment Plant Effluent | ||||||||||||||||||
| Diemer Plant | Jensen Plant | Mills Plant | Skinner Plant | Weymouth Plant | Distribution System | |||||||||||||
| Range | Range | Range | Range | Range | Range | |||||||||||||
| Percent state water project | N/A | % | N/A | N/A | N/A | 0-99 | 100 | 100 | 0-64 | 0-100 | — | N/A | ||||||
Primary Drinking Water Standards |
||||||||||||||||||
| Clarity | Year Tested | Unit | MCL | PHG (MCLG) | In Compliance | Diemer Plant | Jensen Plant | Mills Plant | Skinner Plant | Weymouth Plant | Distribution System | Source | ||||||
| Highest (NTU) | % <= 0.3 | Highest (NTU) | % <= 0.3 | Highest (NTU) | % <= 0.3 | Highest (NTU) | % <= 0.3 | Highest (NTU) | % <= 0.3 | Highest (NTU) | % <= 0.3 | |||||||
| Combined filter effluent (CFE) turbidity2 | 2025 | — | TT | N/A | Yes | 0.05 | 100 | 0.06 | 100 | 0.07 | 100 | 0.07 | 100 | 0.06 | 100 | — | — | SO |
| Microbiological | Year Tested | Unit | MCL | PHG (MCLG) | In Compliance | Diemer Plant | Jensen Plant | Mills Plant | Skinner Plant | Weymouth Plant | Distribution System | Source | ||||||
| Range | Average | Range | Average | Range | Average | Range | Average | Range | Average | Range | Average | |||||||
| Total coliform bacteria3 | 2025 | % Positive Monthly Samples | TT | (0) | Yes | — | — | — | — | — | — | — | — | — | — | 0-0.5 | 0.08 | FE |
| Radiological4 | Year Tested | Unit | MCL | PHG (MCLG) | In Compliance | Diemer Plant | Jensen Plant | Mills Plant | Skinner Plant | Weymouth Plant | Distribution System | Source | ||||||
| Range | Average | Range | Average | Range | Average | Range | Average | Range | Average | Range | Average | |||||||
| Gross alpha particle activity | 2025 | pCi/L | 15 | (0) | Yes | ND-5 | ND | ND | ND | ND | ND | ND-4 | ND | ND | ND | — | — | ER |
| Gross beta particle activity | 2025 | pCi/L | 50 | (0) | Yes | ND-6 | ND | ND | ND | ND | ND | ND-5 | ND | ND-5 | ND | — | — | DK |
| Radium-228 | 2025 | pCi/L | N/A | 0.019 | Yes | ND | ND | ND | ND | ND-1 | ND | ND | ND | ND | ND | — | — | ER |
| Combined radium-226 + 228 | 2025 | pCi/L | 5 | (0) | Yes | ND | ND | ND | ND | ND-1 | ND | ND | ND | ND | ND | — | — | ER |
| Uranium | 2025 | pCi/L | 20 | 0.43 | Yes | ND-3 | 1 | 2-3 | 2 | ND | ND | ND-3 | 2 | ND-3 | ND | — | — | ER |
| Inorganic Chemicals | Year Tested | Unit | MCL | PHG (MCLG) | In Compliance | Diemer Plant | Jensen Plant | Mills Plant | Skinner Plant | Weymouth Plant | Distribution System | Source | ||||||
| Range | Highest RAA | Range | Highest RAA | Range | Highest RAA | Range | Highest RAA | Range | Highest RAA | Range | Average | |||||||
| Aluminum5 | 2025 | ppm | 1 | 0.6 | Yes | ND-0.082 | 0.058 | ND-0.079 | 0.060 | ND-0.096 | ND | ND-0.12 | 0.057 | ND-0.1 | 0.096 | — | — | ER |
| Year Tested | Unit | MCL | PHG (MCLG) | In Compliance | Diemer Plant | Jensen Plant | Mills Plant | Skinner Plant | Weymouth Plant | Distribution System | Source | |||||||
| Range | Average | Range | Average | Range | Average | Range | Average | Range | Average | Range | Average | |||||||
| Barium | 2025 | ppm | 1 | 2 | Yes | 0.13 | 0.13 | ND | ND | ND | ND | ND | ND | 0.129 | 0.129 | — | — | ER, OD |
| Fluoride6 | 2025 | ppm | 2 | 1 (4) | Yes | 0.6-0.8 | 0.7 | 0.6-0.8 | 0.7 | 0.6-0.9 | 0.7 | 0.6-0.8 | 0.7 | 0.5-0.8 | 0.7 | 0.2-0.8 | 0.7 | ER, FL |
| Disinfection Byproducts | Year Tested | Unit | MCL | PHG (MCLG) | In Compliance | Diemer Plant | Jensen Plant | Mills Plant | Skinner Plant | Weymouth Plant | Distribution System | Source | ||||||
| Range | Highest LRAA | Range | Highest LRAA | Range | Highest LRAA | Range | Highest LRAA | Range | Highest LRAA | Range | Highest LRAA | |||||||
| Total trihalomethane (TTHM) (plant core locations and distribution system) | 2025 | ppb | 80 | N/A | Yes | 23-31 | 27 | 10-17 | 14 | 18-36 | 26 | 13-46 | 30 | 24-30 | 31 | 9.8-55 | 33 | DI |
| Sum of five haloacetic acids (HAA5) (plant core locations and distribution system) | 2025 | ppb | 60 | N/A | Yes | ND-3.4 | 3.2 | ND-2.9 | 3 | 1.2-4.4 | 4.2 | 1.4-18 | 9.4 | ND-4.9 | 3.1 | ND-18 | 9.4 | DI |
| Disinfection Byproduct Precursors | Year Tested | Unit | MCL | PHG (MCLG) | In Compliance | Diemer Plant | Jensen Plant | Mills Plant | Skinner Plant | Weymouth Plant | Distribution System | Source | ||||||
| Range | Highest LRAA | Range | Highest LRAA | Range | Highest LRAA | Range | Highest LRAA | Range | Highest LRAA | Range | Highest LRAA | |||||||
| Bromate | 2025 | ppb | 10 | 0.1 | Yes | ND-8.4 | 2.4 | 1.4-6.7 | 4.1 | ND-5.6 | 3.0 | ND-8.3 | 1.8 | ND-12 | 3.0 | — | — | DI |
| Total organic carbon (TOC) | 2025 | ppm | TT | N/A | Yes | 1.6-2.6 | 2.4 | 1.9-2.4 | 2.3 | 1.5-2.9 | 2.0 | 2.0-2.8 | 2.6 | 1.6-2.8 | 2.5 | — | — | VA |
Secondary Drinking Water Standards |
||||||||||||||||||
| Contaminants | Year Tested | Unit | MCL | PHG (MCLG) | In Compliance | Diemer Plant | Jensen Plant | Mills Plant | Skinner Plant | Weymouth Plant | Distribution System | Source | ||||||
| Range | Average | Range | Average | Range | Average | Range | Average | Range | Average | Range | Average | |||||||
| Aluminum | 2025 | ppb | 200 | 600 | Yes | ND-82 | 58 | ND-79 | 60 | ND-96 | ND | ND-120 | 57 | ND-100 | 96 | — | — | RU, SW |
| Chloride | 2025 | ppm | 500 | N/A | Yes | 84-99 | 92 | 46-52 | 49 | 55-59 | 57 | 87-91 | 89 | 86-98 | 92 | — | — | RU, SW |
| Color | 2025 | UNITS | 15 | N/A | Yes | 1 | 1 | 1 | 1 | 1 | 1 | 1 | 1 | 1 | 1 | — | — | OM |
| Specific conductance | 2025 | µS/cm | 1600 | N/A | Yes | 759-987 | 873 | 503-504 | 504 | 386-422 | 404 | 824-847 | 836 | 754-981 | 868 | — | — | SW, IO |
| Sulfate | 2025 | ppm | 500 | N/A | Yes | 146-218 | 182 | 64-78 | 71 | 25-38 | 32 | 164-171 | 168 | 139-212 | 176 | — | — | RU, IW |
| Total dissolved solids, filterable (TDS)7 | 2025 | ppm | 1000 | N/A | Yes | 465-625 | 545 | 293-301 | 297 | 214-241 | 228 | 501-513 | 507 | 456-617 | 536 | — | — | RU |
State-Regulated Contaminants with Notification Levels |
||||||||||||||||||
| Contaminants | Year Tested | Unit | NL | PHG (MCLG) | In Compliance | Diemer Plant | Jensen Plant | Mills Plant | Skinner Plant | Weymouth Plant | Distribution System | Source | ||||||
| Range | Average | Range | Average | Range | Average | Range | Average | Range | Average | Range | Average | |||||||
| Boron | 2025 | ppm | 1 | N/A | Yes | 0.13 | 0.13 | 0.19 | 0.19 | 0.12 | 0.12 | 0.13 | 0.13 | 0.13 | 0.13 | — | — | UR |
| Chlorate | 2025 | ppb | 800 | N/A | Yes | 32 | 32 | ND | ND | ND | ND | ND | ND | 31 | 31 | — | — | UR |
| N-nitrosodimethylamine (NDMA) | 2025 | ppt | 10 | 3 | Yes | ND | ND | 2.1 | 2.1 | ND | ND | ND | ND | ND | ND | ND-2.8 | ND | UR |
Unregulated Compounds and Unregulated Contaminant Monitoring Rule (UCMR) |
||||||||||||||||||
| Constituents | Year Tested | Unit | MCL | PHG (MCLG) | In Compliance | Diemer Plant | Jensen Plant | Mills Plant | Skinner Plant | Weymouth Plant | Distribution System | Source | ||||||
| Range | Average | Range | Average | Range | Average | Range | Average | Range | Average | Range | Average | |||||||
| Alkalinity (total) | 2025 | ppm | N/A | N/A | N/A | 93-122 | 108 | 96-100 | 98 | 68-77 | 72 | 105-108 | 106 | 95-124 | 110 | — | — | UR |
| Calcium | 2025 | ppm | N/A | N/A | N/A | 44-68 | 56 | 31-34 | 32 | 16-20 | 18 | 54-55 | 54 | 43-70 | 56 | — | — | UR |
| Calcium carbonate precipitation potential (CCPP)8 | 2025 | ppm | N/A | N/A | N/A | 2.5-11 | 7.4 | 2.9-6.6 | 4.0 | 2.2-4.7 | 3.0 | 2.5-8.5 | 6.9 | 2.5-11 | 7.6 | — | — | UR |
| Corrosivity (as aggressiveness index)9 | 2025 | AI | N/A | N/A | N/A | 12.3-12.5 | 12.4 | 12.2-12.3 | 12.2 | 12.1-12.3 | 12.2 | 12.3 | 12.3 | 12.3-12.5 | 12.4 | — | — | UR |
| Corrosivity (as saturation index)10 | 2025 | SI | N/A | N/A | N/A | 0.57-0.60 | 0.58 | 0.35-0.43 | 0.39 | 0.36-0.42 | 0.39 | 0.48-0.57 | 0.52 | 0.51-0.61 | 0.56 | — | — | UR |
| Hardness (total) | 2025 | ppm | N/A | N/A | N/A | 191-280 | 236 | 137-142 | 140 | 82-94 | 88 | 228-232 | 230 | 189-280 | 234 | — | — | UR |
| Lithium | 2025 | ppb | N/A | N/A | N/A | 28-42 | 35 | ND | ND | ND | ND | 26-30 | 28 | 27-41 | 34 | — | — | UR |
| Magnesium | 2025 | ppm | N/A | N/A | N/A | 19-25 | 22 | 13-14 | 14 | 9.7-11 | 10 | 21 | 21 | 19-25 | 22 | — | — | UR |
| pH | 2025 | Units | N/A | N/A | N/A | 8.2-8.3 | 8.3 | 8.3-8.4 | 8.3 | 8.7 | 8.7 | 8.2 | 8.2 | 8.2-8.3 | 8.2 | — | — | UR |
| Potassium | 2025 | ppm | N/A | N/A | N/A | 3.8-4.8 | 4.3 | 2.8-2.9 | 2.8 | 2.3-2.5 | 2.4 | 4.2-4.4 | 4.3 | 3.8-5 | 4.4 | — | — | UR |
| Sodium | 2025 | ppm | N/A | N/A | N/A | 78-97 | 88 | 46-50 | 48 | 45-47 | 46 | 83-87 | 85 | 78-100 | 89 | — | — | UR |
| Total dissolved solids, calculated (TDS)11 | 2025 | ppm | 1000 | N/A | N/A | 333-657 | 507 | 280-301 | 292 | 173-300 | 234 | 424-635 | 525 | 346-660 | 506 | — | — | UR |
1: Water supply purchased from MWD via the Central Basin Municipal Water District (Central Basin MWD).
2: MWD monitors turbidity at the CFE locations using continuous online meters and grab samples. Turbidity, a measure of cloudiness of the water, is an indicator of treatment performance. Turbidity was in compliance with the TT of primary drinking water standard and the secondary drinking water standard of less than 5 NTU.
3: Per the Surface Water Treatment Rule, TTs that remove or inactivate Giardia cysts will also remove HPC bacteria, Legionella, and viruses. Legionella and virus monitoring are not required.
4: Samples are collected quarterly for gross beta particle activity, and annually for tritium and strontium-90. Gross alpha particle activity, radium, and uranium data are from samples collected quarterly in 2023 for the required triennial monitoring (2023-2025). Radon is also monitored voluntarily with the triennial radionuclides.
5: Compliance for aluminum is based on locational running annual average (LRAA). The values shown under the "Average" column are LRAAs.
6: MWD was in compliance with all provisions of the State's fluoridation requirements. When fluoride feed systems were temporarily out of service during treatment plant shutdowns and/or maintenance work, an occasional fluoride level was measured below 0.7 mg/L.
7: MWD's TDS compliance data are based on flow-weighted monthly composite samples collected twice per year (April and October). The 12-month statistical summary of flow-weighted data is reported in the Unregulated Contaminants section.
8: Positive CCPP indicates non-corrosive and tendency to precipitate and/or deposit scale on pipes. Negative CCPP indicates corrosive and tendency to dissolve calcium carbonate. Reference: Standard Method 2330.
9: AI ≥ 12.0 indicates non-aggressive water; AI 10.0-11.9 indicates moderately aggressive water; AI ≤ 10.0 indicates highly aggressive water. Reference: ANSI/AWWA Standard C400-93 (R98).
10: Positive SI indicates non-corrosive and tendency to precipitate and/or deposit scale on pipes. Negative SI indicates corrosive and tendency to dissolve calcium carbonate. Reference: Standard Method 2330.
11: Statistical summary represents 12 months of flow-weighted data, and values may be different than the TDS reported to meet compliance with secondary drinking water standards. MWD's calculated TDS goal is 500 mg/L.
Thank you
 Thanks for taking the time to learn more about your water quality.
Visit our web site to get information about your account, water-use history, water rates, and water system. You will also find water-saving tips and news about water conservation programs and rebates available in your area.